

“Prometheus-compatible” is one of the least informative phrases in observability marketing.
Usually, it means: we’ll accept your scrape endpoint. Point it at us, we’ll store the series, and from then on you’re using our platform with your data in it.
That is not the same as actually reading your Prometheus – understanding what metrics exist, what is normal for your environment, and what has changed.
And that difference matters when you put AI on top.
An AI SRE agent grounded in your real Prometheus can reason about your environment. One working from a generic model of Kubernetes can only guess what should be there.
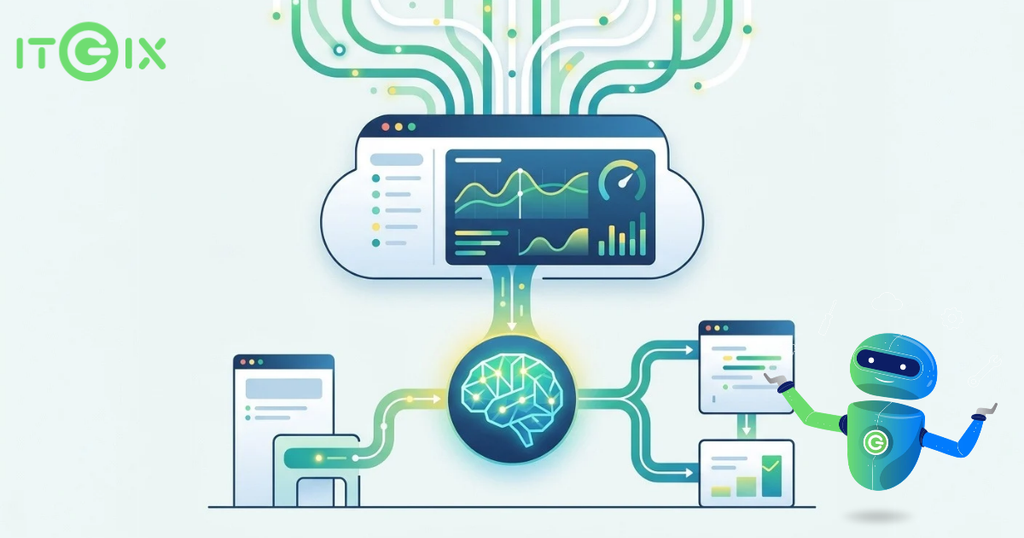
This post looks at what changes when the platform reads the metrics instead of simply receiving them.
Why a Generic Model of Your Environment Isn’t Enough
Every AI-driven observability product has some idea of a “typical” environment: common exporters, familiar metric names, standard thresholds, and predefined alert patterns.
That creates two predictable problems.
Rules for Things You Don’t Run
A generic rule library can produce PostgreSQL alerts for a cluster without PostgreSQL, JVM alerts for Go services, and nothing for a custom exporter your team has been running for years.
The result is either noise or missing coverage.
Metric Names That Don’t Exist
Ask a language model to write a PromQL alert and it can produce something that looks perfectly valid.
The metric name may follow conventions. The labels may look reasonable.
But does that series actually exist in your Prometheus?
The model cannot know unless it queries the environment.
A rule against a nonexistent metric never fires. It can look like coverage without providing any.
The solution to both problems is the same:
Read the live metric catalog first. Then reason about it.
What “Reading Prometheus” Actually Means
A per-environment agent connects to the client’s actual Prometheus and reads what is really there:
- metric names
- label names
- label values
- metadata
- historical data
Nothing is inferred from a generic environment.
That live connection becomes the foundation for three capabilities.
1. Know What’s There → Recommend Relevant Rules
The platform can compare the live metric catalog against a curated rule library organized by technology.
If pg_stat_activity_count exists, PostgreSQL rules become relevant. If it doesn’t, they don’t.
The result is a set of recommendations based on what the environment actually runs.
For example:
| Detected technology | Example recommendations |
|---|---|
| Spring Boot | High CPU, Memory Usage |
| Node Exporter | CPU, Memory, Availability |
| PostgreSQL | Connection usage, Activity |
| Nginx | HTTP 5xx Rate |
Illustrative examples based on the Rule Designer concept.
The experience we’re building follows a familiar cloud-provider workflow: select an environment, see relevant rules grouped by technology, choose what you need, and adjust thresholds.
Teams that don’t want to write PromQL can start with recommendations. Teams that want full control can open the generated expression and edit it.
For a multi-tenant platform, suggested rules can also go through an administrative review process before entering the shared library.
2. Know What’s Normal → Use Real History for Thresholds
Historical data provides something generic best practices cannot: your actual distribution.
With 30 days of metric history, the platform can calculate:
- P50
- P90
- P95
- P99
Those values provide evidence for whether a threshold makes sense.
A threshold below P50 may fire constantly. A threshold above the historical maximum may never fire.
Threshold Intelligence is designed to surface those percentiles while the threshold is being configured, rather than making engineers inspect a chart afterwards.
The same analysis can evaluate the rule itself:
- well tuned
- firing during normal behaviour
- unlikely to fire even when the service is under serious stress
The next step is conversational threshold tuning: ask the agent whether an alert is well tuned, then review and approve a suggested change.
The same statistical approach also matters during incident investigation.
A large percentage change is not automatically meaningful. A noisy metric can swing dramatically while remaining within normal behaviour.
The statistical investigation tools we’re adding calculate the baseline standard deviation and flag a change only when it exceeds twice that baseline variation.
The calculation is performed in PromQL itself.
That gives the model a checkable signal rather than a number it has to interpret from a graph.
3. Ground the AI → Claims Must Come From Your Prometheus
This is where the Prometheus architecture connects directly to the AI SRE agent.
The agent accesses metrics through a small set of typed tools, such as:
list_metrics → list_labels → list_label_values → get_metadata
Each request is scoped to the environment the agent is authorized to access, and every tool call and result is recorded.
The important consequence is simple:
The model cannot reliably claim a metric exists unless the tool actually returned it.
Suppose an RCA states:
“Connection pool utilisation on
payments-dbreached 97% at 14:02.”
The verifier can trace that claim back to the tool call that retrieved the relevant series and value.
A metric the model invented has no supporting tool call behind it and can therefore be classified as unsupported.
That is the difference between asking an AI to “be accurate” and grounding the AI in real telemetry.
Prometheus Is Part of the Authoring Experience
The live metric connection shouldn’t exist only in the backend.
The PromQL editor used for rules and dashboards can provide autocomplete against the client’s actual metric and label set.
That means discovery and authoring happen in the same flow.
The same environment-specific catalog also feeds custom dashboards, including:
- stat tiles
- gauges
- time series
Everything is built from the metrics that actually exist in that environment.
The goal is to avoid the usual choice between:
easy but generic
and
powerful but empty.
Reading Prometheus first makes it possible to provide both guided workflows and raw PromQL control on the same platform.
Where This Fits in the ITGix AIOps Platform
The connection to Prometheus is a core part of the ITGix AIOps Platform, not a separate monitoring feature.
The platform uses the live metric environment as the foundation for alerting, investigation, and AI-powered RCA.
The flow looks like:
Prometheus → metric discovery → alerting → investigation → AI-powered RCA
That same data is also used to ground the AI SRE agent.
Instead of giving the model a generic representation of what a Kubernetes environment might look like, the platform lets it query the metrics that actually exist.
That makes the investigation more specific to the environment – and makes individual claims traceable to real telemetry.
What’s Live and What’s in Progress
Being precise matters here, because “reads your Prometheus” is exactly the kind of claim that should be easy to verify.
Live Today
- Metric discovery from the connected environment
- Rule recommendations grouped by technology
- Metric, label, and metadata tools for the agent
- Custom dashboards
- PromQL editor
Designed and in Progress
- Guided Rule Designer
- Suggestion and approval queue
- Threshold Intelligence with inline percentiles
- Conversational threshold tuning
- Statistical significance testing for investigation
The important distinction is between capabilities that are already running and those still being built.
Connect Prometheus. Build Alerts From Reality.
The direction we’re building toward is straightforward:
Connect Prometheus and let the platform work from what your environment actually contains.
No generic template pack applied blindly.
No PromQL generated against an imaginary metric.
No AI claim without a real metric behind it.
Instead:
live metrics, real history, environment-specific alerting, and an AI SRE agent grounded in the telemetry it actually retrieved.
That is why the AI reads your Prometheus – rather than working from a model of it.
Keep an eye on the ITGix blogs for the next chapter.

