

From Alerts to Incidents
A node goes bad in a Kubernetes cluster! Within 90 seconds, the Alert Manager has fired a node alert, a dozen pod alerts, a handful of workload alerts and a namespace-level alert.
The incident tool opens a ticket for each one. The on-call engineer gets paged fifteen times for one problem and treats every page like it’s the first, because nothing in the pipeline knows they’re related. Now multiply that across dozens of client environments!
The usual response is to write better alert rules, tune your thresholds or add more inhibition rules. All useful. However, none of it scales on its own, because volume isn’t necessarily a symptom of bad rules.
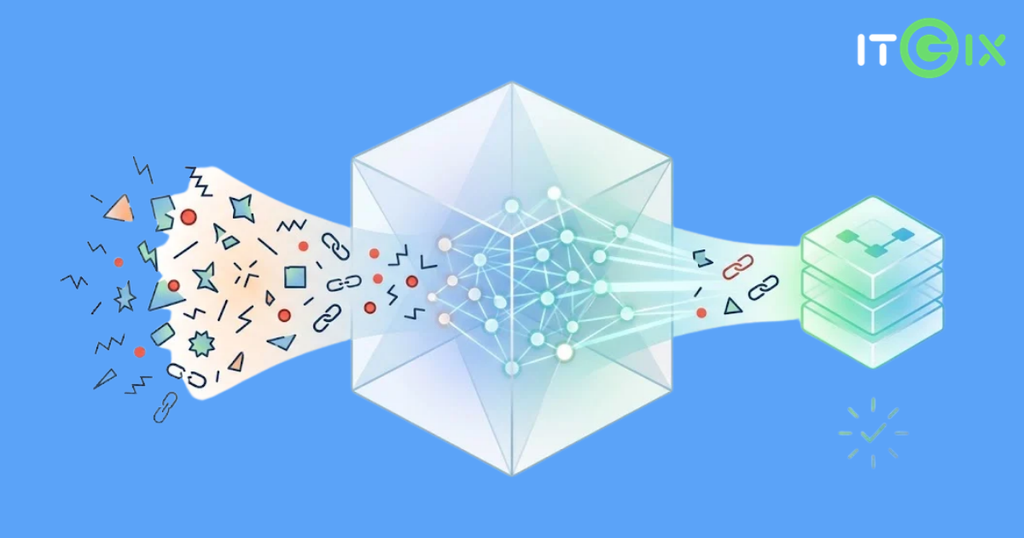
It’s a symptom of treating every alert as if it deserves the same response. But it doesn’t! Our goal is simple to say: one problem should become one incident with one notification and a story attached.
The first thing our incident-management pipeline has to get right is the distinction. An alert is a signal that a condition is true. An incident is a unit of work for a human.
Most tooling collapses the two: one alert, one ticket. That’s why the queue becomes unmanageable.
Why Grouping Similar Alerts Doesn’t Work
To begin with, we collapse repeats of the same alert on the same unique ID. This removes the obvious repetition before the more expensive ML-based scoring begins.
After that, we may want to cluster alerts that look alike by name, namespace or timing. The problem is that related alerts are often not alike at all.
NodeMemoryPressure, PodCrashLooping and HighLatency have different names, different labels and different owners. A similarity-based approach keeps them apart.
What makes those alerts one incident isn’t how they look – it’s where they sit: on the same node, behind the same service or on two services where one calls the other.
The missing element is structure.
A Graph of the Environment
For that purpose, we keep a live topology graph of every customer environment. It’s built from metrics we already scrape:
- Vertices are the things that can fail: nodes, pods, services, workloads, ingresses, volumes, etc.
- Edges are the ways failures spread.
Mapping an Alert onto the Graph
An alert is just a bag of labels. It never says where it belongs to. So we use a mapping function:

Here, A is the set of incoming alerts and V is the set of topology vertices. φ is an ordered chain of simpler matchers, and the first one that finds a vertex wins:

In simpler terms, “x ▹ y” means “use x if it found something, otherwise try y”. The order goes from the most specific evidence to the most generic one.
When φ(a) = ∅, the alert becomes an orphan. It still flows through as a standalone incident. We just don’t pretend to know where it lives.
Group by Connection
Once alerts are on the graph, the question becomes “which alerting things are connected?” We build a subgraph that contains only the alerting vertices V_A – then add an edge between two of them.

After that, we find the weakly connected components of ( V_A, E_A). The headline metric is compression:

Fifty alerts becoming two components is 96% fewer things for a human to look at.
Teaching the System
Grouping tells us which alerts belong together. It doesn’t tell us how much they matter. That’s where machine learning comes in.
We turn every alert into a canonical sentence. That way, the model learns from what the alert says. That text goes through a sentence encoder:

Here, τ is the canonicalization step and eₐ is a unit vector in an N-dimensional space. Alerts that mean similar things land near each other, even when their names differ.
On top of the embeddings sit two histogram-based boosting classifiers. They are fast to train, cheap to run and handle dense embedding features without much tuning.
However, a classifier always returns an answer, including for alerts it has never seen anything like. So, every prediction also gets a confidence score: how close the vector is to the nearest example the model was trained on.
Then, for a whole component C, we ask about the group as a unit. We average the member embeddings and re-normalize:

Then the component’s severity is:

Root Cause and Impact
A group of connected, classified alerts is far more useful when it comes with a story.
Every member is given a role:
- Root cause: The highest-priority alert on the origin. This is “start here”.
- Direct impact: Other alerts sitting on that same origin.
- Propagated impact: Everything downstream, reached by walking the graph outward from the root.
Priority is ordered by tier first, then severity, then start time.
For propagated alerts, we explain how the failure got there with a shortest-path search from the root. Each hop costs a large constant plus a small weight for the relationship type.
From Components to Incidents
Components are recomputed continuously and alerts keep arriving and recovering. The hard part is keeping a stable identity: the incident at 03:04 and the incident at 03:09 must be the same ticket.
- Timing: We don’t fire on the first alert. A burst gets a short settle window so the component can form, and that window is shorter when something critical is already firing. After that, we re-correlate on a regular interval or immediately if the alert count jumps sharply.
- Matching: A fresh component is matched to an open incident by comparing the alert fingerprints they contain, using an overlap coefficient:

- Merging: If one component overlaps two open incidents, it has bridged them: two outages that looked separate turned out to share a cause. They merge into one, and the oldest incident survives. That’s the ticket people have already been looking at and commenting on.
- Deduplication: Every revision is fingerprinted by what actually matters: severity, root cause, members and their roles, and affected services. Timestamps and confidence jitter are left out. If nothing meaningful changed, nothing is published. Without this, the ticket would get the same comment every minute for the whole outage.
- Closing: When every member of an incident has recovered, it’s resolved automatically. The result goes out as one correlated incident and becomes one Jira or GLPI ticket with one notification.
RCA Feeding Back
Correlation answers “what happened together.” Root-cause analysis answers “why.”
Each correlated incident is handed to our AI-assisted RCA. The RCA starts from the triage story instead of from a raw alert list.
Engineers then give a verdict on the RCA: confirmed, partially confirmed or rejected.
The next step is turning them into training signals. A rejected root cause or an incident an engineer downgraded at 3 AM, because it could have waited until morning, is then handed off for retraining – every reviewed incident makes the next one that much more accurate!
Turning Noise Into Narrative
When a cluster goes down, engineers don’t need fifty fragments of the same failure – they need the story.
By mapping raw alerts onto a live graph, we anchor noisy signals in real system relationships rather than guesswork. Machine learning accelerates this process by handling deduplication, severity scoring and impact paths – all while keeping every decision transparent and traceable.
The payoff is immediate: radical noise reduction, instant clarity and human feedback that loops directly into retraining, making every incident clearer than the last.
Automated triage isn’t about hiding complexity in a black box. It’s about turning 15 disjointed pages into a single, actionable tale. This way, on-call teams can spend less time piecing together context and more time fixing the actual problem.
Keep an eye on the ITGix blogs for the next chapter!

