

A node goes bad in a Kubernetes cluster.
Within ninety seconds, Alertmanager has fired a node alert, a dozen pod alerts, a handful of workload alerts, and a namespace-level alert. Your incident tool opens a ticket for each one. Your on-call engineer gets paged fifteen times for one problem and treats every page like it’s the first, because nothing in the pipeline knows they’re related.
Now multiply that across dozens of client environments.
The usual response is a discipline problem framed as advice: write better alert rules, tune your thresholds, add more inhibition rules. All useful. None of it scales on its own, because the volume isn’t necessarily a symptom of bad rules.
It’s a symptom of treating every alert as if it deserves the same response.
It doesn’t.
Deciding which alerts deserve which response is a statistics problem, and it should be solved with statistics you can inspect.
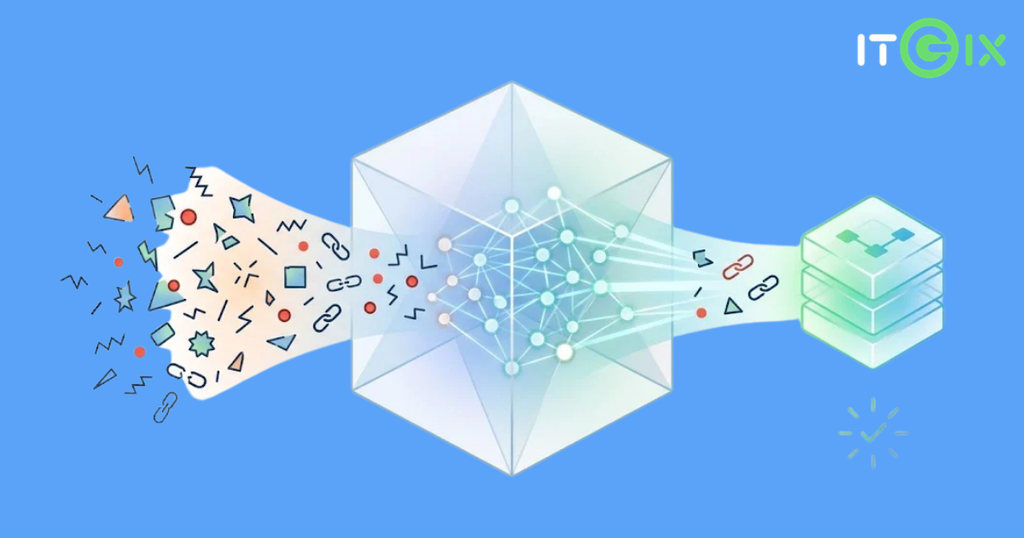
Alerts Are Not Incidents
The first thing an incident-management pipeline has to get right is the distinction.
An alert is a signal that a condition is true. An incident is a unit of work for a human – something with an owner, a timeline, a resolution, and an SLA clock.
Most tooling collapses the two: one alert, one ticket. That’s why the queue becomes unmanageable.
The pipeline we’re building treats the gap between them as its whole job:
ingest → normalize → fingerprint → TRIAGE → correlate → incident → notify → RCA → resolve → learn
Everything up to fingerprinting is bookkeeping – turning heterogeneous alert payloads into a canonical shape and giving each one a stable identity.
Everything after correlation is workflow – the ticket in GLPI or Jira, the notification, the root cause analysis, and the resolution.
The interesting part is in the middle: triage and correlation, where the platform answers one question before anything else happens:
Does this alert deserve full investigation, and how urgently?
Not Every Alert Needs the Same Response
A binary “page or don’t page” decision is too blunt.
The triage engine outputs four tiers:
| Tier | Meaning | What happens |
|---|---|---|
| IMMEDIATE | High confidence this matters now | Root cause analysis starts immediately |
| QUEUED | Matters, but not urgently | RCA starts within SLA |
| WATCH | Probably noise, but unproven | Monitored; escalates if it persists or clusters |
| SUPPRESS | Noise | Logged, never lost — but no ticket, page, or AI spend |
That last column is worth pausing on.
Triage runs before the expensive LLM-based investigation step. Every alert that lands in WATCH or SUPPRESS instead of IMMEDIATE is a model call you didn’t pay for.
Better triage isn’t just fewer pages. It’s a direct, measurable lever on the cost of every incident the AI does investigate.
How Automated Alert Triage Works
The engine is a multi-stage pipeline. Every stage is independently switchable and tunable by the operator, and none of them produces a black-box score.
1. Deduplication and Noise Gating
First, collapse repeats of the same alert on the same fingerprint.
Then drop anything below a tunable “interest” threshold before spending further compute on it.
This removes obvious repetition before the more expensive statistical scoring begins.
2. Entropy-Based Alert Scoring
The next step uses techniques from published, peer-recognized alert-triage research.
Temporal entropy measures how unusual a firing pattern is. A heartbeat that fires every five minutes scores near zero; something that has never fired before scores near one.
Semantic entropy measures how specific the alert text is, using plain TF-IDF over your own alert corpus. “Host down” is generic and scores low; “OOMKilled postgres-primary” is specific and scores high.
There’s no trained model and no vendor vocabulary. The scoring self-updates from your history.
A third scorer, topology-aware entropy, becomes available once the platform has a dependency map.
3. Bayesian Signal Fusion
Next, five categories of evidence contribute likelihoods to a running posterior:
- Severity and SLO burn rate
- Alert-storm detection – how many alerts are firing, how quickly, and where this alert sits in the cascade
- Blast radius – how many namespaces are affected and whether shared infrastructure is involved
- Component layer – infrastructure or data-layer failures receive a higher prior than application-level failures
- Historical context – whether this alert type has caused impact before, how noisy it has been, and whether a runbook exists
Every likelihood is a number you can see and edit.
The cold-start prior is 0.30. After each resolved incident, the priors for that alert type are updated from what actually happened.
4. Escalation-Speed Ranking with Survival Analysis
Bayesian scoring answers whether an alert needs attention.
The next stage determines in what order alerts should be handled within a tier.
A Cox proportional-hazards model is trained on your resolved-incident history to identify which features predict that an alert will turn into an SLO breach or P1 fastest.
The output remains legible: a table of hazard ratios with significance, for example:
“Shared infrastructure: 3.1× faster to escalate.”
There is an important constraint: this requires three to six months of resolved incidents, roughly 200+, before it can train.
It isn’t a day-one capability, and we say so.
5. Alert Correlation and Clustering
This is where related alerts become one incident instead of fifteen.
Five interchangeable strategies can run in the order you configure them, with the first match winning:
- Deterministic rules for known recurring patterns, such as “same host + same check within 15 minutes”
- Time-window proximity for storms from unknown sources
- Topology-aware grouping once a dependency map exists
- ML co-occurrence once enough history is available
- Human feedback, learning from operators’ merge and split actions over time
The result is a shift from alert volume to incident context.
Prove the Change Before You Turn It On
This is the part we think matters most – and the part that’s absent from much of AIOps tooling.
Any change to the triage configuration – a weight, a threshold, or a new correlation recipe – can be replayed against your real historical alerts before it is applied.
Pick the last 7 or 30 days. The platform shows the current configuration and proposed configuration side by side:
| Tier | Current | Proposed |
|---|---|---|
| IMMEDIATE | 142 | 89 (▼37%) |
| QUEUED | 203 | 241 |
| WATCH | 89 | 94 |
| SUPPRESS | 566 | 576 |
| Noise ratio | 34% | 41% |
| Estimated false IMMEDIATE | 28 | 12 |
Illustrative figures from the design, not customer data.
The totals are only part of the picture.
The platform also shows individual alerts that would change tier, so you can inspect the reclassifications:
“SlowDBQuery, prod, eight times a day: QUEUED → SUPPRESS”
versus:
“PodCrashLoop on the API gateway: WATCH → IMMEDIATE”
You see the individual changes, not just an aggregate improvement.
And nothing changes in production until you’ve seen evidence that the proposed configuration actually helps.
The Safety Rails Around Automated Triage
Grouping and suppression can hide a real incident if they’re wrong. So the pipeline has several safeguards:
- SUPPRESS means logged, not deleted. Every alert remains retained and queryable. The tier controls what the alert triggers, not whether it exists.
- Shadow mode first. Correlation runs for weeks, producing verdicts that change nothing. The platform measures disagreement against what operators actually did before allowing it to attach a symptom to an existing incident instead of opening a new one.
- A critical alert on an entity with no other open alarm is never suppressed. A grouping rule cannot swallow the first sign of a new problem.
- Every tier decision is recorded with the signals and scores that produced it. If an engineer asks, “Why didn’t this page me?” there’s an answer.
There’s also a reporting consequence worth planning for.
Once symptoms attach to incidents instead of opening separate tickets, your incident count drops. Any SLA or DORA reporting built on ticket counts will shift.
That’s the point, but it needs to be understood before the system is switched on – not discovered in a quarterly review.
What We’re Building First
This is a phased build, and we’d rather be specific than vague. These capabilities are being developed as part of the ITGix AIOps Platform, where automated alert triage is one layer of a broader incident-resolution workflow.
The nearest-term slice is deduplication, Bayesian scoring, and rule- and time-window-based correlation.
Entropy scoring follows once there’s a couple of weeks of alert corpus to build on.
Survival-analysis ranking activates only when an environment has enough resolved-incident history.
Topology-aware correlation depends on the service dependency map – the subject of the next post.
Human-feedback learning is the longest-horizon piece.
Try Automated Alert Triage Against Your Own History
The simulation mode is the demo.
Not a slide. Your last 30 days of real alerts, replayed through the pipeline, with the before-and-after tiers on screen.
If the noise doesn’t drop, you’ve lost nothing.
If it does, you’ve seen the number before committing to anything.
Keep an eye on the ITGix blogs for the next chapter.

